y=log_a(x) <=> x=a^y where “a” is unknown. Let’s say the progress bar in the image is between 0 and 1. That puts the cheetah on about 0.2. It is know that cheetahs run at a maximum speed of 75mph. This gives us 0.2=log_a(75) <=> a^0.2=75 <=> a=2373046875 Therefore, we have the relationship x=2373046875^y. For the speed of light, y=0.6. That gives us x=2373046875^0.6=421875mph. It is known that the speed of light is 671000000mph. 421875mph << 671000000mph

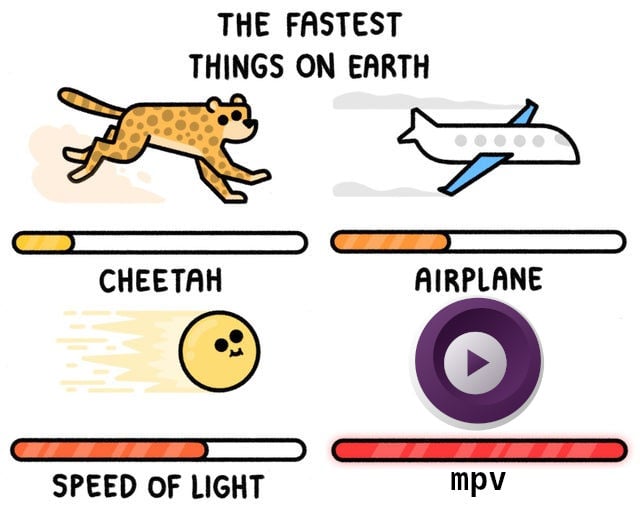
Cheetahs are 1/2 the speed of airplanes and 1/3 the speed of light. Ok, got it.
It’s possible that it’s a logarithmic scale.
y=log_a(x) <=> x=a^y where “a” is unknown. Let’s say the progress bar in the image is between 0 and 1. That puts the cheetah on about 0.2. It is know that cheetahs run at a maximum speed of 75mph. This gives us 0.2=log_a(75) <=> a^0.2=75 <=> a=2373046875 Therefore, we have the relationship x=2373046875^y. For the speed of light, y=0.6. That gives us x=2373046875^0.6=421875mph. It is known that the speed of light is 671000000mph. 421875mph << 671000000mph
Still doesn’t make any sense.
it’s a double log… y = log(log(x))…
or maybe *graph not to scale
That would make way more sense when you’re talking about relative speeds of the speed of light and pretty much anything else.
They used the Windows 95 Microsoft progress bar code