y=log_a(x) <=> x=a^y where “a” is unknown. Let’s say the progress bar in the image is between 0 and 1. That puts the cheetah on about 0.2. It is know that cheetahs run at a maximum speed of 75mph. This gives us 0.2=log_a(75) <=> a^0.2=75 <=> a=2373046875 Therefore, we have the relationship x=2373046875^y. For the speed of light, y=0.6. That gives us x=2373046875^0.6=421875mph. It is known that the speed of light is 671000000mph. 421875mph << 671000000mph

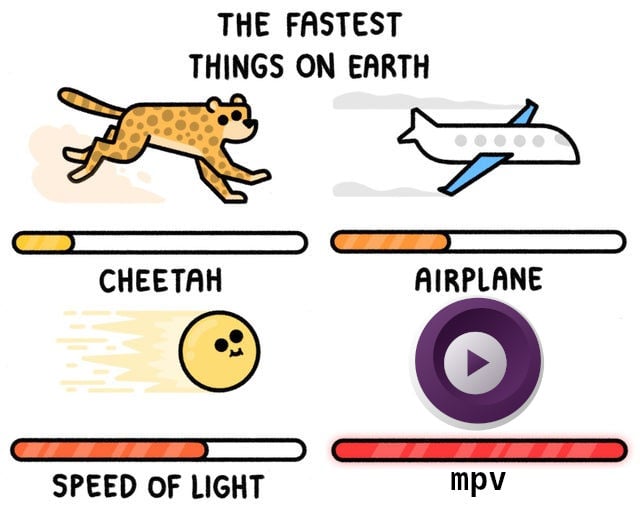
y=log_a(x) <=> x=a^y where “a” is unknown. Let’s say the progress bar in the image is between 0 and 1. That puts the cheetah on about 0.2. It is know that cheetahs run at a maximum speed of 75mph. This gives us 0.2=log_a(75) <=> a^0.2=75 <=> a=2373046875 Therefore, we have the relationship x=2373046875^y. For the speed of light, y=0.6. That gives us x=2373046875^0.6=421875mph. It is known that the speed of light is 671000000mph. 421875mph << 671000000mph
Still doesn’t make any sense.
it’s a double log… y = log(log(x))…
or maybe *graph not to scale