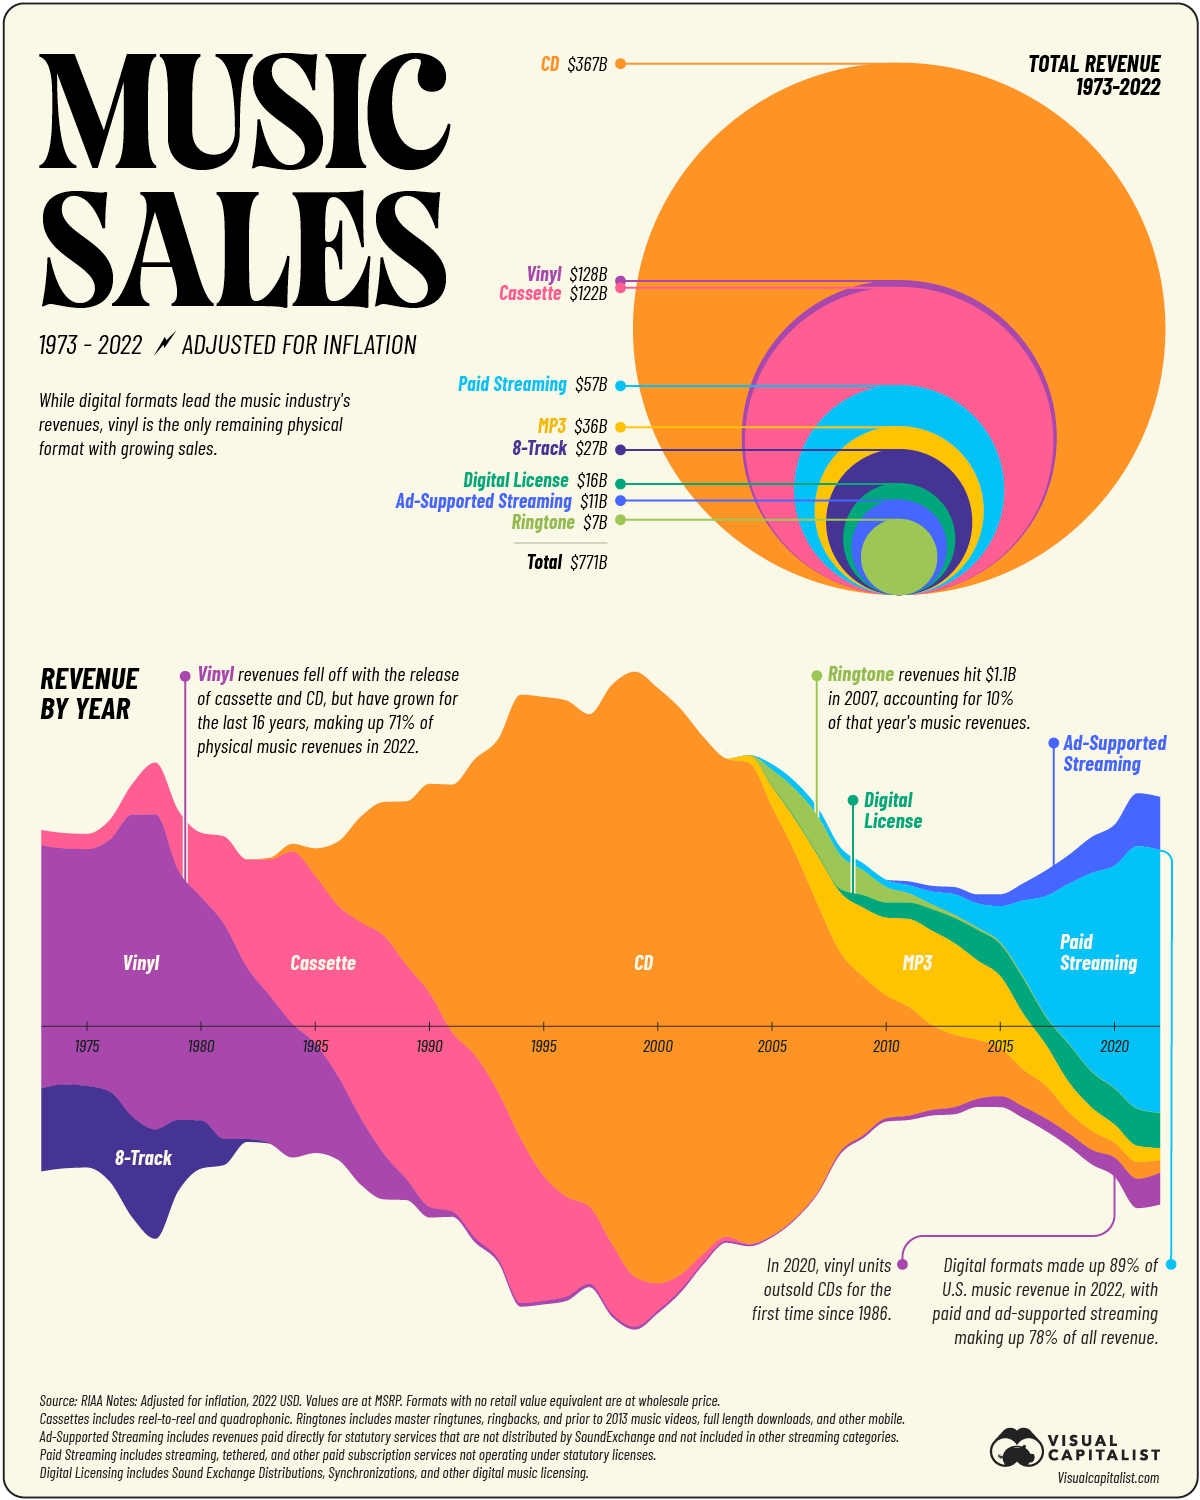
surface of the circle is directly proportional to the revenue, this presentation is much better to compare two values to each other (if you have problem comparing how much 367 is compared to 128 and need an image for that, that is). it would be harder in the pie chart.
if you want share of the total, the bottom graph is much better for that (and it adds layer of information that pie graph wouldn’t have).
i assume that is why.
Circle area’s are really hard to compare. A circle with double the area of another barely looks bigger.